

Have you ever paused before hitting that “donate” button, wondering about the real story behind NGO finances? You’re not alone. In a world where trust is paramount, questions about donation transparency surround every charitable gift. This post delves into the surprising secrets of nonprofit finances, revealing where your hard-earned dollars, rupees, euros, or other currency actually go. We’ll unpack nonprofit financial reporting, charity fund allocation, and the nuts and bolts of financial accountability in NGOs. By the end, you’ll feel empowered to make smarter decisions, knowing your contribution fuels real change.
At Unessa Foundation, we’ve seen firsthand how clear nonprofit finances build lasting donor trust. Stick around as we break it all down, backed by fresh stats and real examples.
The Basics of NGO Finances: What You Need to Know
Let’s start simple. Nonprofit finances aren’t some mysterious black box; they’re a structured system designed to turn your generosity into action. At its core, an NGO’s budget splits into a few key buckets: program expenses (the good stuff that directly helps people), administrative costs (the unglamorous but necessary overhead), and fundraising expenses (what it takes to keep the lights on and campaigns running).
Why does this matter? Because understanding these basics shines a light on where donations go. According to recent data, U.S. charitable giving hit a whopping $592.50 billion in 2024, with projections for at least 3.9% growth in 2025. But not all of that cash flows equally; transparency is the gatekeeper.
Think of it like your household budget. You wouldn’t hand over your paycheck without knowing if it’s buying groceries or funding a spontaneous vacation. NGOs operate similarly, guided by standards from bodies like the IRS (for U.S.-based orgs) or equivalent regulators elsewhere. Financial accountability in NGOs ensures every penny is tracked, from receipt to receipt (the kind for impact, not shopping).
One key trend shaking up the finances of NGO in 2025? Digital tools. Online donations are climbing 13% annually throughout the year, making real-time tracking easier than ever. Yet, despite tech advances, donor skepticism lingers. A 2025 survey found that 68% of potential givers hesitate due to worries over charity fund allocation. That’s where donation transparency comes in; it’s not just nice; it’s essential for survival.
Why Donation Transparency Builds (or Breaks) Donor Trust in NGOs
Picture this: You donate $100 to help educate kids in rural India, inspired by a heartfelt story. Weeks later, you wonder if that money buys books or just pays for ads? This nagging doubt erodes donor trust in NGOs, and it’s a growing pain point.
Donation transparency isn’t buzzword bingo; it’s a proven powerhouse. Funders pour 62% more cash into organizations that openly share how gifts are used, per a 2025 philanthropy survey. Why? Because transparency flips the script from “trust me” to “see for yourself.”
In the nonprofit world, financial accountability NGOs means publishing audited statements, breaking down NGO spending by category, and even sharing program-specific impact metrics. Trends show a shift toward “radical transparency,” think live dashboards on websites showing real-time fund flows. For instance, 81% of donors now prefer orgs that offer in-kind donation tracking or recurring gift breakdowns.
But here’s a twist: Not all NGOs nail this. Scandals, like the 2010 Haitian earthquake relief mishaps where only 60% of funds reached the ground, still haunt the sector. (Note: That’s an older case, but lessons linger.) Today, forward-thinking groups counter this with proactive nonprofit financial reporting, fostering loyalty. Donors who feel informed give 25% more over time, studies confirm.
Actionable tip: Before donating, scan for badges from watchdogs like Charity Navigator. They rate transparent NGOs on a scale, spotlighting stars in charity finances.
- Pro tip: Look for orgs publishing IRS Form 990s publicly, which detail every dime of NGO budget breakdown.
- Quick win: Email the NGO asking for a sample impact report. Responsive ones? Gold standard for donor trust NGOs.
Decoding Charity Fund Allocation: A Typical NGO Budget Breakdown
Ever wondered what a “healthy” pie chart looks like? Let’s slice it up. On average, 75-85% of funds go straight to programs, which is where donations go. Admin hovers at 10-15%, and fundraising caps at 10-20%. But that 80% sweet spot? It’s the surprising secret many orgs chase.
Take 2025 trends: With economic squeezes like tariffs and job cuts, nonprofits are tightening belts, pushing program spending to 82% on average. Here’s a quick breakdown:
| Category | Average Allocation | What It Covers |
|---|---|---|
| Program Expenses | 80% | Direct aid, like education or health initiatives |
| Administrative Costs | 12% | Salaries, office ops, compliance |
| Fundraising Expenses | 8% | Campaigns, events, donor outreach |
This isn’t arbitrary watchdogs like the Better Business Bureau recommend at least 65% to programs for a “good” rating. Yet, variations abound. Environmental NGOs might skew higher on programs (90%), while advocacy groups dip to 70% due to policy work.
Real insight: In-kind donations, like goods over cash, now make up 20% of inflows, stretching NGO spending further. For donors, this means your $50 book drive could amplify impact without inflating cash overhead.
Case in point: Doctors Without Borders. Their 2024 report showed 82% to field ops, with crystal-clear NGO budget breakdowns online. Donors rave, citing it as a model for transparent NGOs.
Media Recommendation: Embed an infographic here showing the pie chart above. Alt text: “NGO finances breakdown chart illustrating 80% charity fund allocation to programs.”
Transitioning smoothly, let’s zoom into stories that bring these numbers to life.
Real-Life Examples: Case Studies in Transparent NGO Finances
Numbers are cool, but stories stick. Let’s spotlight two orgs nailing nonprofit financial reporting and one that learned the hard way.
First, the shining star: The Red Cross. Post-2010 scandals, they revamped with blockchain-like tracking for funds. A 2025 case study in China and Spain highlighted their shift: Now, 88% of donations hit programs, with public dashboards detailing every euro. Result? Donor retention up 35%. Their secret? Quarterly “transparency teasers” short videos breaking down NGO spending.
Contrast that with a cautionary tale: A mid-sized African aid NGO in 2023 faced backlash when audits revealed 25% “lost” to admin bloat. Donors fled, halving funds overnight. The fix? Adopting open-source accounting, boosting program allocation to 78% within a year.
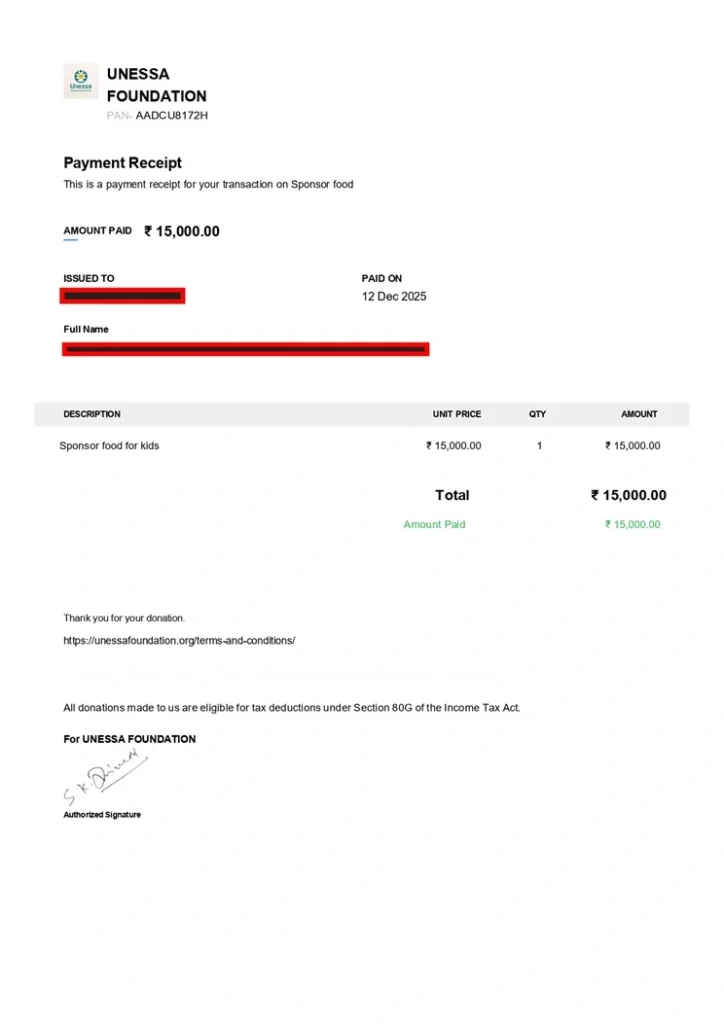
Now, a positive pivot: Unessa Foundation. Focused on education in India, we allocate 85% of gifts to on-ground programs like school builds. Our annual reports? Public and punchy, with photos linking dollars to smiling kids. It’s built donor trust NGOs swear by.
These cases underscore industry insights: Transparent NGOs see 40% higher engagement rates. Tip: Hunt for orgs with “impact receipts” personalized updates on your gift’s journey.
How to Spot and Support Financially Accountable NGOs
Empowerment time: You don’t need a finance degree to vet nonprofit finances. Here’s your step-by-step guide to ensuring that where donations go aligns with your values.
- Scrutinize Ratings: Head to Charity Navigator or GuideStar. Look for 4-star transparency scores; they flag strong financial accountability NGOs.
- Demand Breakdowns: Request a sample budget. Does it show a clear charity fund allocation? Red flag if programs dip below 70%.
- Track Digital Footprints: In 2025, top transparent NGOs use apps for live NGO budget breakdowns. Bonus: Recurring donors get auto-updates.
- Ask the Right Questions: “What percentage of donations reach the cause?” or “How do you handle overhead?” Vague answers? Walk away.
FAQs
Where Does Your Donation Really Go?
Straight to the programs, ideally. On average, 80% funds have a direct impact, such as food distribution or education. The rest? Overhead that keeps the engine running. Always check the NGO’s pie chart for proof.
How to Verify NGO Financial Transparency?
Start with public filings on GuideStar.org. Cross-check ratings on Charity Navigator, and request an impact report. Tools like blockchain trackers (used by 15% of top NGOs in 2025) offer real-time peeks.
What Percentage of Donations Reach the Cause?
Aim for 75%+. Watchdogs flag anything under 65% as concerning. Transparent NGOs often hit 80-90%, per 2025 benchmarks.
Are NGOs Transparent with Finances?
Most strive to be, but it varies. 70% publish annual reports, but only 40% do quarterly breakdowns. Seek out those with “A” grades for donor trust NGOs.
Best Practices for NGO Financial Disclosure
- Publish audited statements quarterly.
- Use visuals like infographics for NGO budget breakdowns.
- Offer personalized “your gift at work” stories.
How Can I See How My Donation Is Used?
Opt for orgs with donor portals. Post-gift, expect emails with photos and metrics. For extras, follow-up responsive ones shine in charity fund allocation.
Donate to Transparent NGOs Online?
Absolutely, platforms like GlobalGiving vet for transparency. Filter by ratings, and you’re golden for secure, impactful giving.
Wrapping Up: Make Your Mark with Smarter NGO Finances Choices
We’ve peeled back the layers on nonprofit finances, from the surprising 80% program punch to the power of donation transparency in sparking donor trust. Remember, your gift isn’t just money, it’s momentum. By choosing financially accountable NGOs, you’re not only maximizing impact but joining a movement toward ethical charity finances.
At Unessa Foundation, transparency isn’t optional; it’s our promise. We invite you to explore our reports and see your potential role in shaping futures.
Ready to give with confidence? Start small, verify big, and watch change unfold. What’s one step you’ll take today?


 Verified NGO